stelaraX - Order BlocksstelaraX – Order Blocks
stelaraX – Order Blocks is a technical analysis indicator designed to identify, visualize, and manage bullish and bearish order blocks based on swing structure and impulsive price movement. The indicator focuses on institutional price zones and tracks their lifecycle from creation to mitigation or invalidation.
Order blocks are detected using pivot highs and pivot lows and are only validated when followed by a minimum impulsive price move, ensuring structurally relevant zones.
Core logic
The indicator detects order blocks using swing-based market structure:
* bullish order blocks are formed from swing lows followed by an impulsive upward move
* bearish order blocks are formed from swing highs followed by an impulsive downward move
The originating candle of the order block can be defined using different calculation modes:
* Last Candle
* Wick to Wick
* Full Range
Each order block stores its full range, midpoint level, creation bar, and current state.
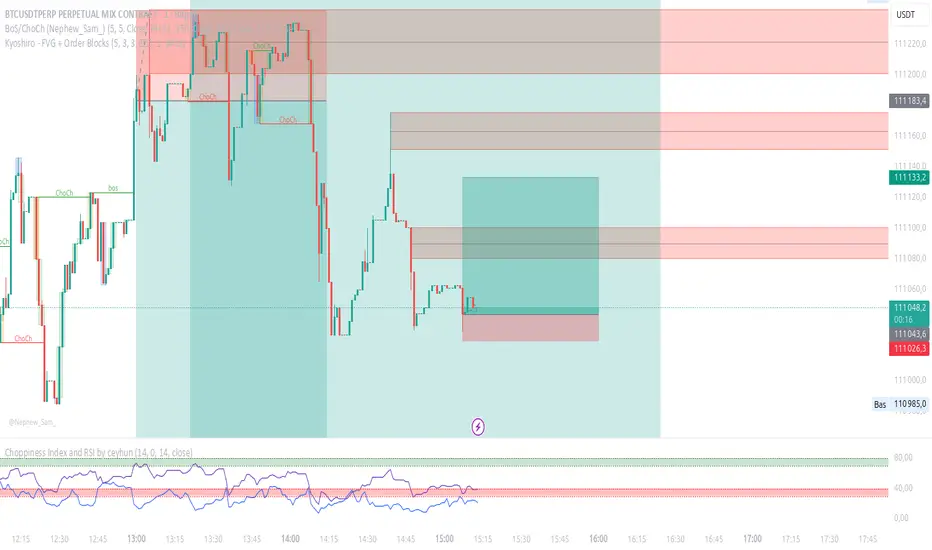
Mitigation and breaker blocks
Order blocks are monitored in real time for mitigation.
Mitigation can be defined as:
* first touch
* 50 percent retracement
* full fill of the order block
Once mitigation occurs, an order block can:
* remain visible in a mitigated state
* be removed automatically
* convert into a breaker block if price fully violates the zone
Breaker blocks represent structurally broken order blocks and are highlighted separately.
Visualization
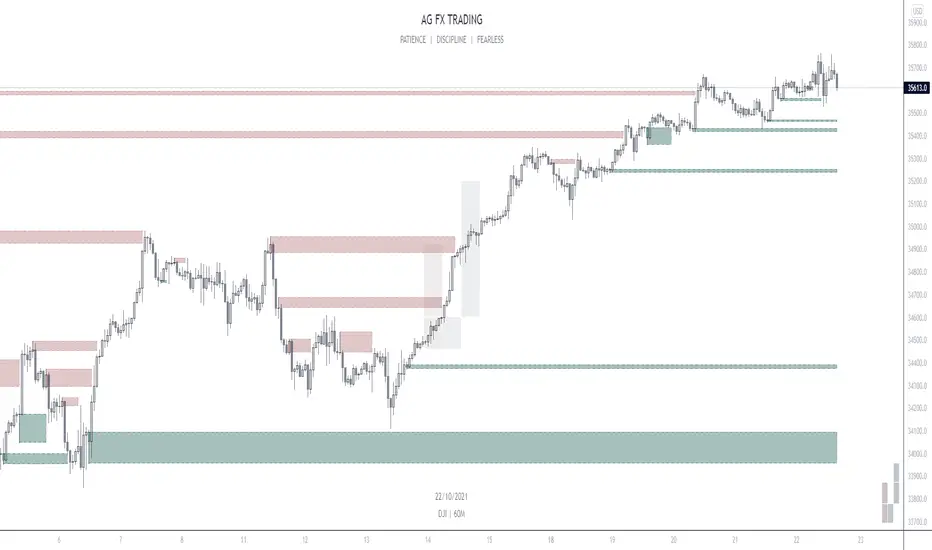
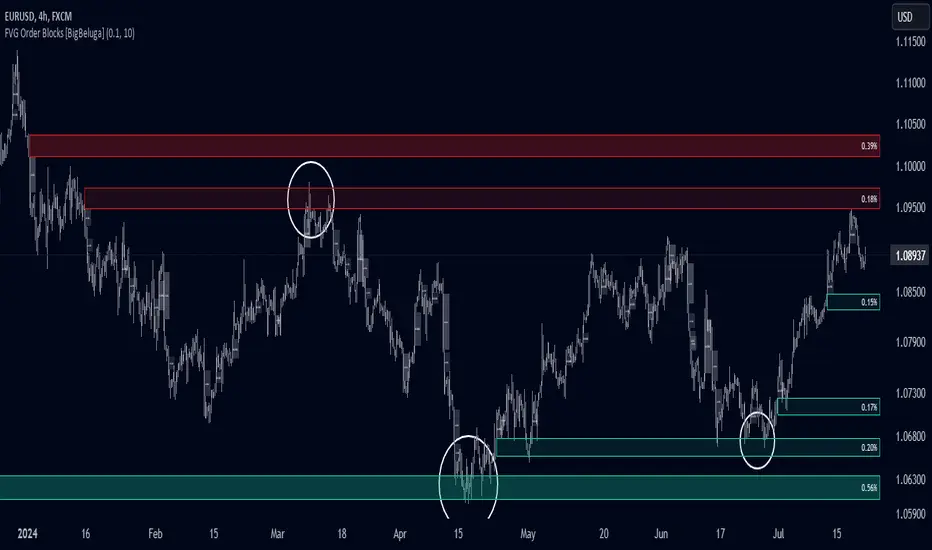
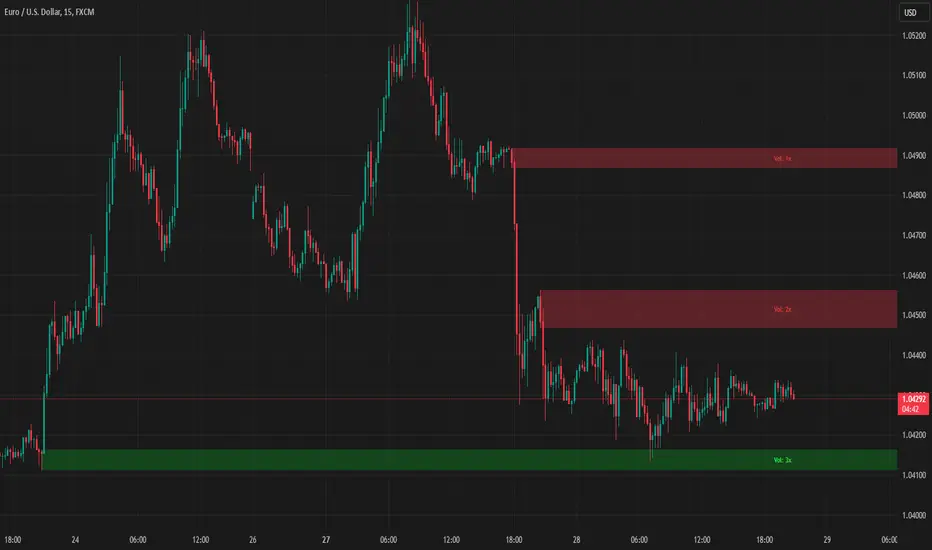
Order blocks are displayed directly on the chart using colored zones:
* bullish order blocks are shown in green tones
* bearish order blocks are shown in red tones
* mitigated order blocks are faded
* breaker blocks are highlighted using a separate color
Optional features include:
* midpoint level line
* order block labels
* automatic extension of active blocks
* configurable maximum number and maximum age of blocks
All visual elements are fully customizable.
Dashboard
An optional on-chart dashboard provides a real-time overview of:
* total bullish and bearish order blocks
* mitigated order blocks
* active unmitigated blocks
* breaker blocks
* mitigation percentages
Dashboard position and text size are configurable.
Alerts
Alert conditions are available for:
* newly detected bullish order blocks
* newly detected bearish order blocks
Additional alerts are triggered when order blocks are mitigated or converted into breaker blocks.
Use case
This indicator is intended for:
* order block and supply and demand analysis
* institutional-style market structure trading
* identifying high-interest price zones
* multi-timeframe confluence analysis
Disclaimer
This indicator is provided for educational and technical analysis purposes only and does not constitute financial advice or trading recommendations. All trading decisions and risk management remain the responsibility of the user.
Penunjuk Pine Script®